Bilder
Poster
Videos
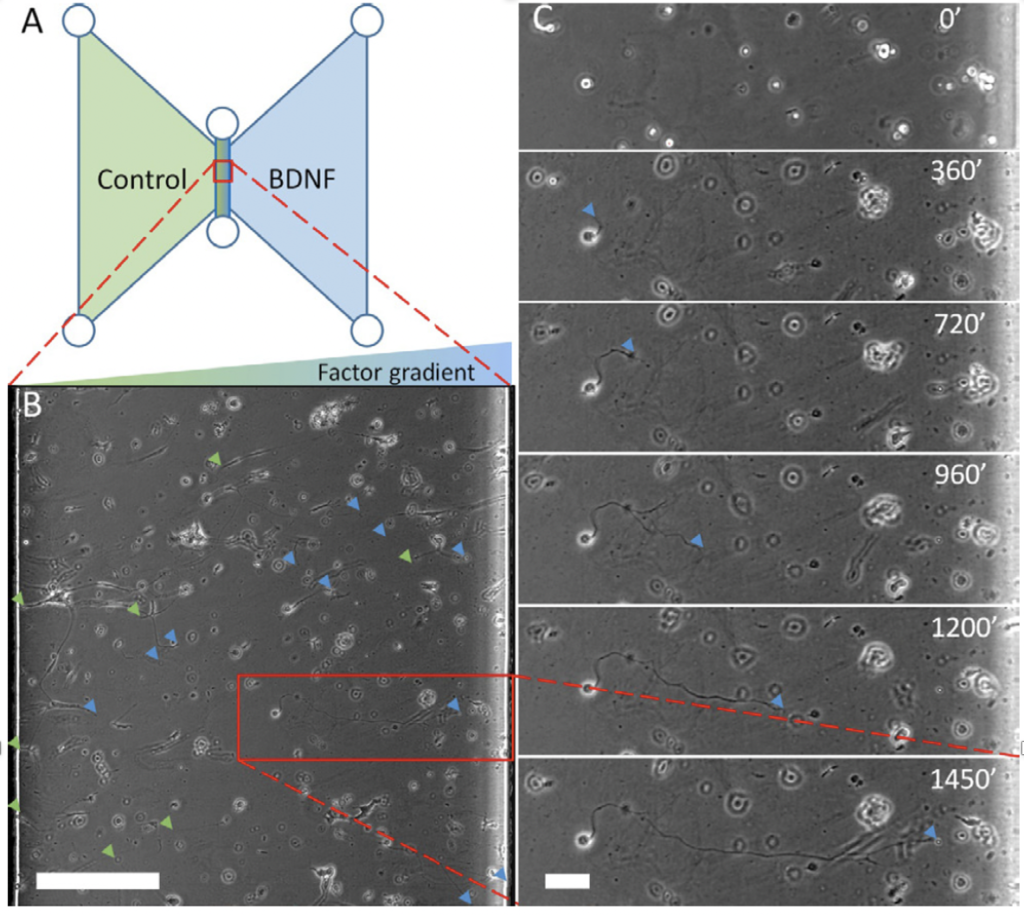
(A) Schematic representation of the Ibidi µ-slide chemotaxis chamber – blue and green indicate test factor-containing media and control media respectively. The viewing chamber cross section in 1 mm wide, but only 70 µm in height, keeping axons in a singe focus plane. The central viewing chamber is 2 mm in length. (B) Topographical view of a portion of viewing chamber, with test factor gradient indicated above. Growth cones traveling left are depicted with green arrow heads, whereas growth cones traveling to the right are marked with blue arrow heads. The expected 30 % of sensory neuron BDNF sensitivity bias in observed. (C) A time-lapse series depicting the growth cone behavior of a sensory neuron exposed to a gradient of BDNF (from the right side). Blue arrows indicate lead growth cone.
Scale bar: (B) 250 µm; (C) 50 µm
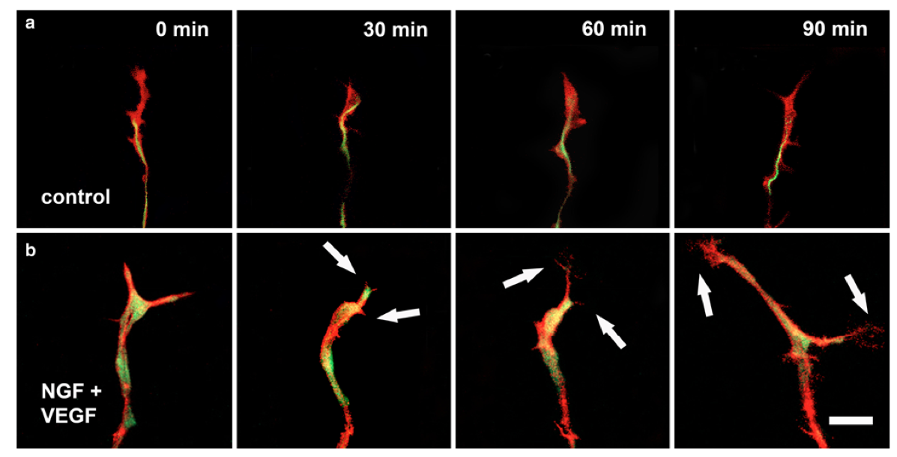
Live cell imaging of cytoskeletal dynamics within the growth cone. Microunjected, double-transfected primary DRG-cells were observed for approximately 2 h. Distribution and dynamics of GFP-NF-M and RFP-actin within the same neuron were analyzed. Growth cones were agile for the entire period of observation, palpating the environment. While growth cones in controls (a) showed static movement, samples treated with NGF + VEGF (b) showed highly accelerated filopodia and lamellipodia turnover, and started growing with directional movement. Scale bar 10µm
Influence of VEGF on DRG growth cones. a Time-lapse images revealed that GEGF is able to directly attract the growth cone. Images were acquired at 15-second intervals with the aid of phase-contrast optics. A microcapillary was filled with mVEGF165 and localized 7-10µg/ml from he tip of the growth cone. Scale bar = 10µm. b Quantitative analysis of growth cone velocity. Growth rate was significantly enhanced under VEGF stimulation at a concentration of 10µg/ml * p < 0.05. c Moreover, we observed that the growth cone moved exactly in the direction of the capillary at a VEGF concentration of 10µ/ml. This effect was not achieved at the control condition (A. dest.) or with lower concentrations of VEGF (0.1µg/ml). Scale bar = 20µm.
